 |
What is SNR difference
The frequency response of the amplifiers on the track is not ideal.
Therefore 5 and 10MHz frequencies may be transmitted with different
strength. That causes bit patterns with 5MHz content to have different bit
error rate (BER) than those with 10MHz content.
If the difference is too high, it means that the signal is being distorted
on the way and that the electronics doesn't work properly. |
|
|
|
|
Requirements
- A computer with 1 free full duplex network card or 2 free
half duplex cards
- If 2 half duplex AUI cards are used, then
Half Duplex Reduction (HDR)
- Linux where C programs can be compiled.
- GNU R installed
- Bertest installed
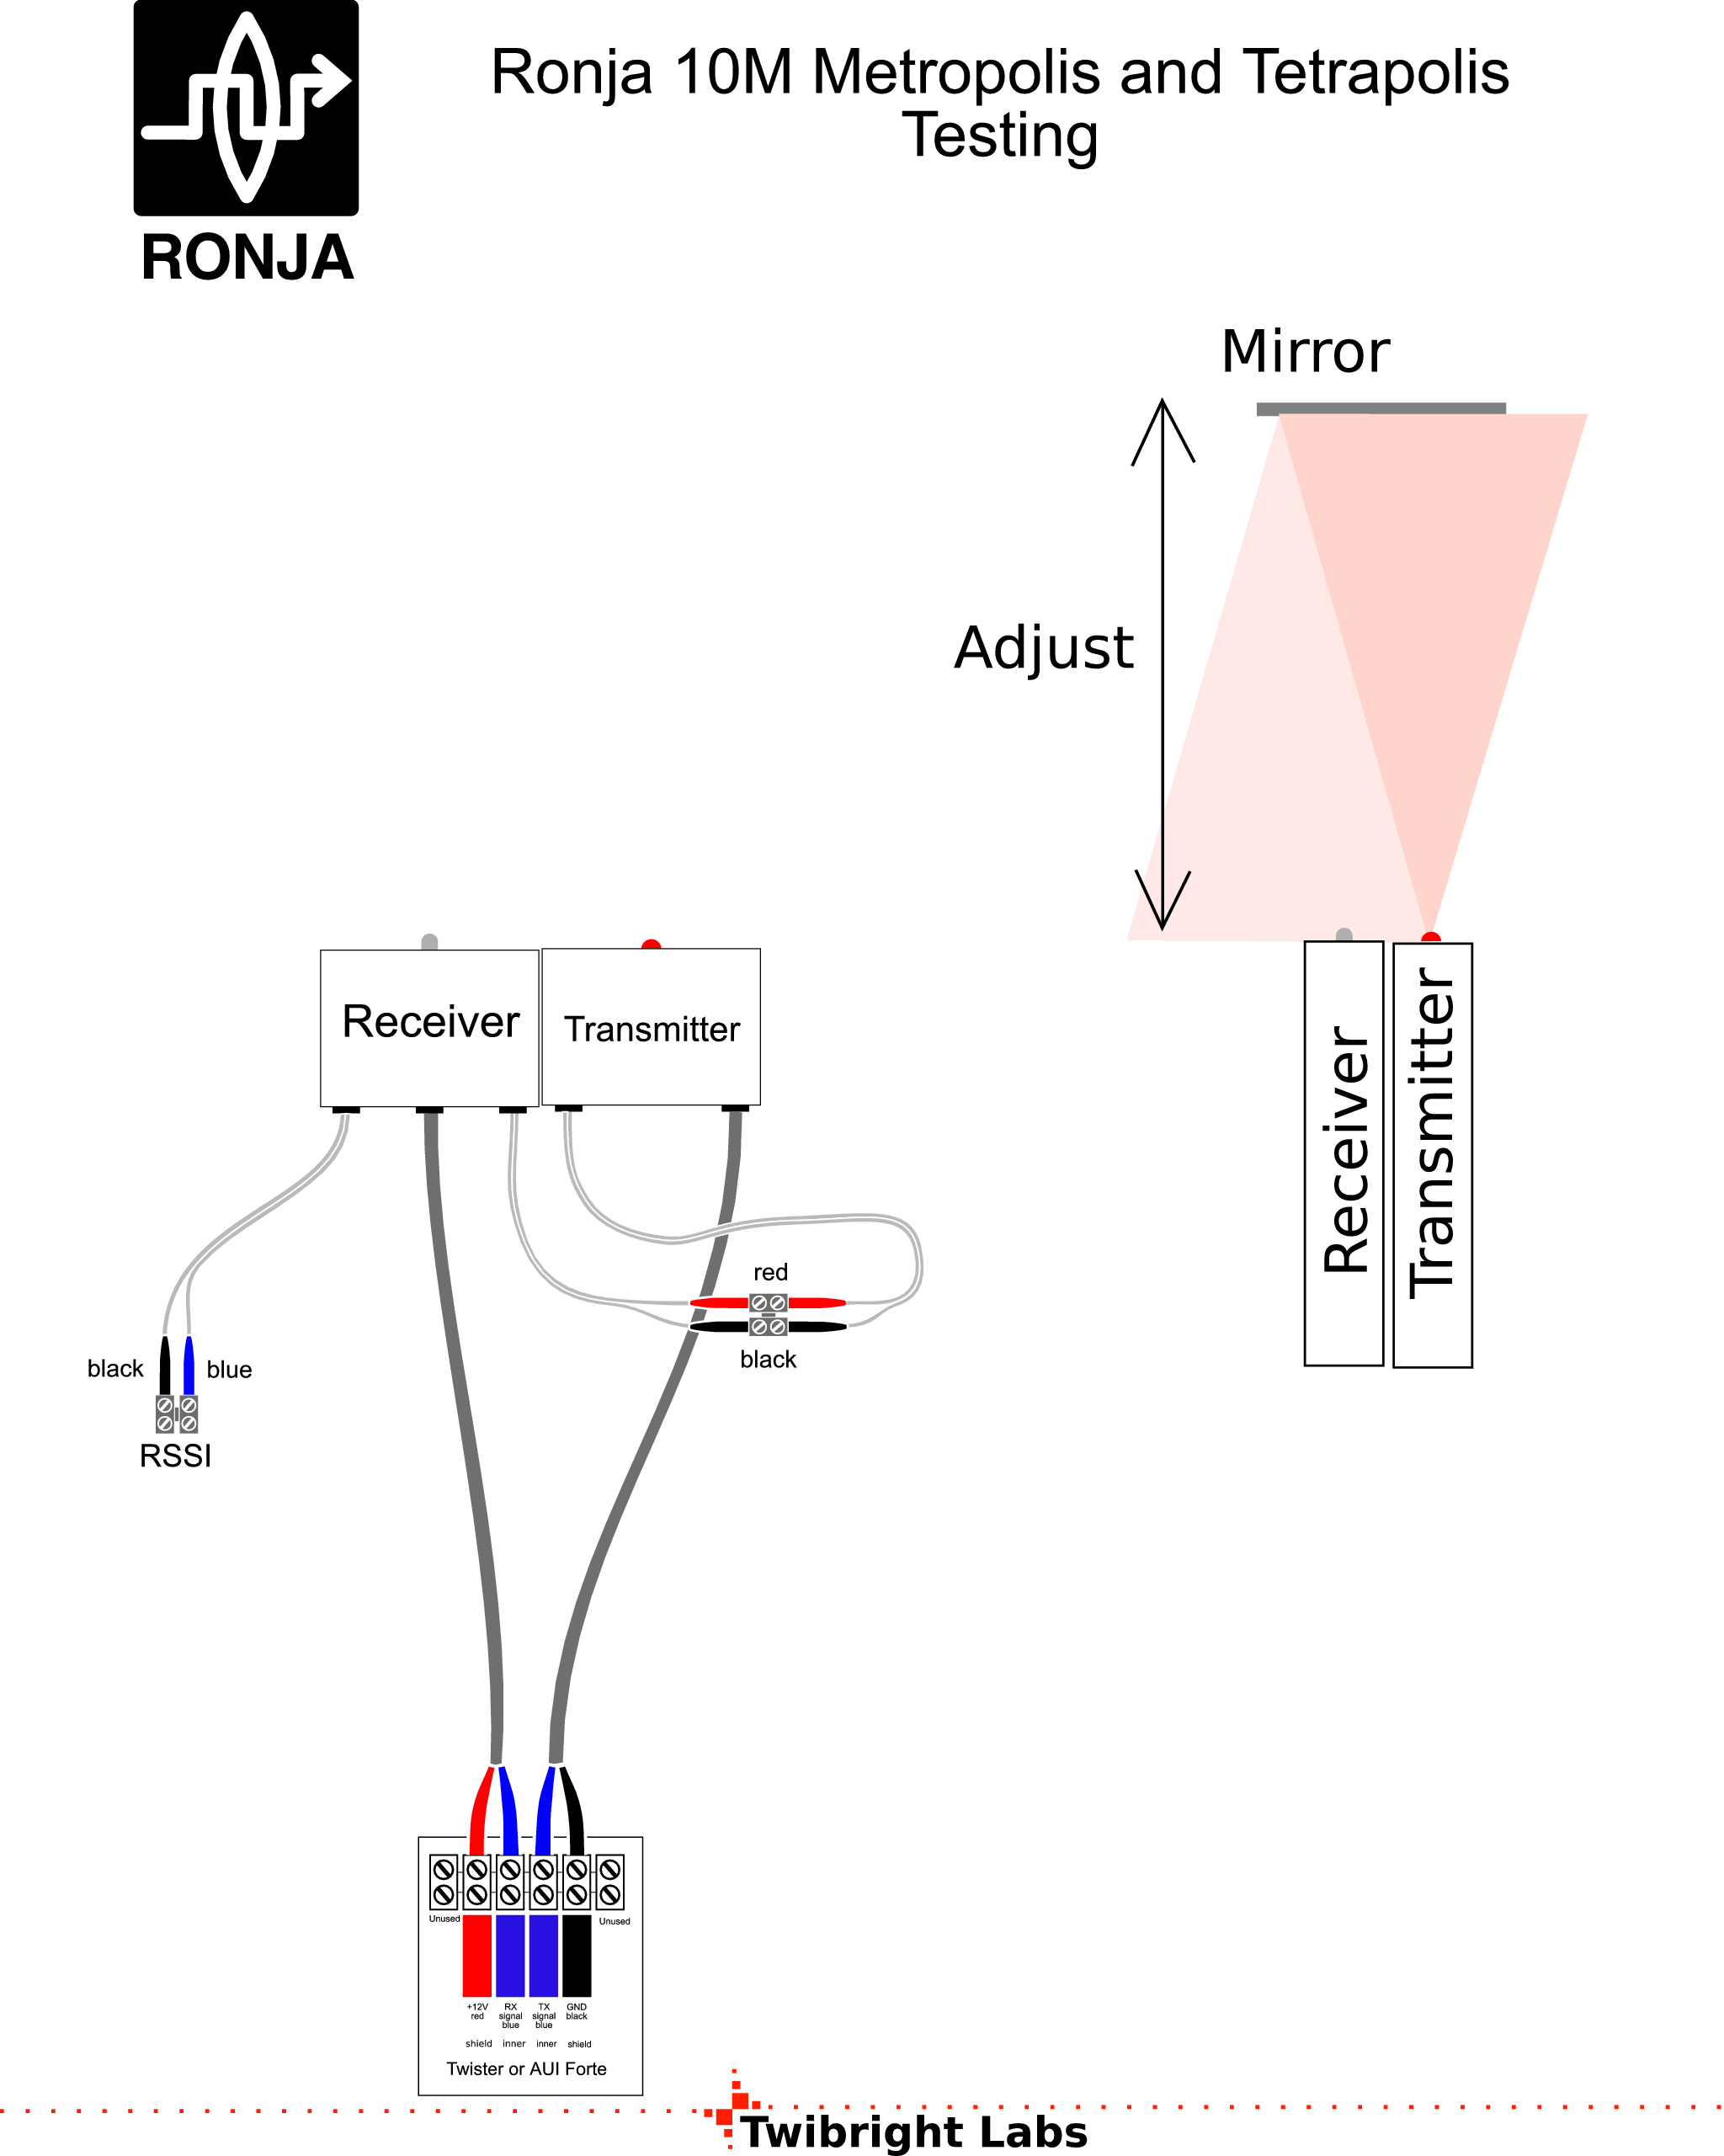
- A mirror or long enough extension cables for RX or TX
- Having the electronics not installed inside optical heads
|
|
|
Network card (NIC) setup
If you are going to use just one NIC, set up full duplex and
10Mbps with autonegotiation disabled.
Some hints. |
|
Connect the DUT (Device Under Test)
- With 1 full duplex card, connect the DUT to that card
- With 2 network cards and half duplex reduction (HDR), connect HDR
into the 2 NICs and DUT into the HDR. Transmitting card
is the one with "T" end of the HDR and receiving with "R"
- With 2 network cards you need 2 tested devices (Twisters
or AUI Forte's) and plug one into each card.
|
|
Running pktloss
If your input and output network card is eth0, run pktloss.
If eth1 is input and output, run pktloss eth1. If eth1
is output and eth2 input, run pktloss eth1 eth2. |
|
|
|
In such a case the output will be like this:
1102885167.075454000    100.000 100.000 1024    2224
1102885167.645578000    100.000 100.000 1024    2224
1102885168.215306000    100.000 100.000 1024    2224
1102885168.785415000    100.000 100.000 1024    2224
1102885169.355167000    100.000 100.000 1024    2224
1102885169.925561000    100.000 100.000 1024    2224
Second and third column show packetloss at 10MHz and 5MHz in percent. |
|
|
|
|
Device with packetloss connected
In such a case the output will look like this :
1102885377.652586000    13.868  77.637  1024    2224
1102885378.222727000    14.649  80.372  1024    2224
1102885378.792451000    17.969  83.692  1024    2224
1102885379.362579000    17.188  85.157  1024    2224
1102885379.932404000    22.364  84.961  1024    2224
1102885380.502458000    15.528  79.883  1024    2224
1102885381.072232000    13.379  76.661  1024    2224
1102885381.642390000    15.918  75.196  1024    2224
1102885382.212091000    12.793  87.012  1024    2224
Second and third column show packetloss at 10MHz and 5MHz in percent. |
|
|
|
|
Distance adjustment
Run the measurement and adjust the distance between RX
and TX so that both
second and third columns show numbers with 50 roughly between them (0
and 100 should never occur if possible).
Example output:
1102885377.652586000    13.868  77.637  1024    2224
1102885378.222727000    14.649  80.372  1024    2224
1102885378.792451000    17.969  83.692  1024    2224
1102885379.362579000    17.188  85.157  1024    2224
1102885379.932404000    22.364  84.961  1024    2224
1102885380.502458000    15.528  79.883  1024    2224
1102885381.072232000    13.379  76.661  1024    2224
1102885381.642390000    15.918  75.196  1024    2224
1102885382.212091000    12.793  87.012  1024    2224
[...]
|
|
|
Measurement
Choose output filename describing the measurement you are doing, we'll
use example.dat for example.
Let it run with output redirected into a file this way for a couple of minutes:
bertest <arguments> > rx_1.dat
|
|
Running GNU R
Now run
./analyze example.dat (replace example.dat with your datafile name).
example.ps and
example.pdf will be generated. |
|
SNR difference
Display the resulting Postscript or
PDF and goto page 17. Read SNR difference
from left edge of graph at page 14. |
|
Evaluation
I am getting values like 0.7dB or 1dB. I consider these normal. |
|

 Contact, support: Clock
on the Internet Relay Chat.© 1998-2016 Karel ‘Clock’ Kulhavý et al..
Contact, support: Clock
on the Internet Relay Chat.© 1998-2016 Karel ‘Clock’ Kulhavý et al.. 