 |
Requirements
|
|
|
Network card (NIC) setup
If you are going to use just one NIC, set up full duplex.
Full duplex hints.
|
|
Get rid of any traffic into the NIC
- Kill all running dhcp daemons running on the interface (possibly
ps ax | grep dhcp to list them).
- Remove IP address (possibly
ifconfig eth? 0.0.0.0)
|
|
|
|
Looping the AUI Forte back
Put a small piece of wire between the signal terminals of the AUI Forte
according to the picture. |
|
|
Running pktloss
If your input and output network card is eth0, run pktloss.
If eth1 is input and output, run pktloss eth1. If eth1
is output and eth2 input, run pktloss eth1 eth2. |
|
|
|
In such a case the output will be like this:
1102885167.075454000    100.000 100.000 1024    2224
1102885167.645578000    100.000 100.000 1024    2224
1102885168.215306000    100.000 100.000 1024    2224
1102885168.785415000    100.000 100.000 1024    2224
1102885169.355167000    100.000 100.000 1024    2224
1102885169.925561000    100.000 100.000 1024    2224
Second and third column show packetloss at 10MHz and 5MHz. |
|
|
|
|
Device with packetloss connected
In such a case the output will look like this:
1102885377.652586000    13.868  77.637  1024    2224
1102885378.222727000    14.649  80.372  1024    2224
1102885378.792451000    17.969  83.692  1024    2224
1102885379.362579000    17.188  85.157  1024    2224
1102885379.932404000    22.364  84.961  1024    2224
1102885380.502458000    15.528  79.883  1024    2224
1102885381.072232000    13.379  76.661  1024    2224
1102885381.642390000    15.918  75.196  1024    2224
1102885382.212091000    12.793  87.012  1024    2224
Second and third column show packetloss at 10MHz and 5MHz. |
|
|
Measurement
Choose output filename describing the measurement you are doing, we'll
use example.dat for example.
Let it run with output redirected into a file this way for a couple of minutes:
bertest <arguments> > rx_1.dat
|
|
Running GNU R
Now run
./analyze example.dat (replace example.dat with your datafile name).
example.ps and
example.pdf will be generated. |
|
BER in PDF output
Display the resulting Postscript or
PDF and go to page 12. There you can
see filtered measurement of the BER. Read the higher value of the two.
The unfiltered results are on page 2. |
|
Evaluation
BER should be under 10^-9. If it's worse, then something is wrong with the
electronics. |
|

 Contact, support: Clock
on the Internet Relay Chat.© 1998-2016 Karel ‘Clock’ Kulhavý et al..
Contact, support: Clock
on the Internet Relay Chat.© 1998-2016 Karel ‘Clock’ Kulhavý et al.. 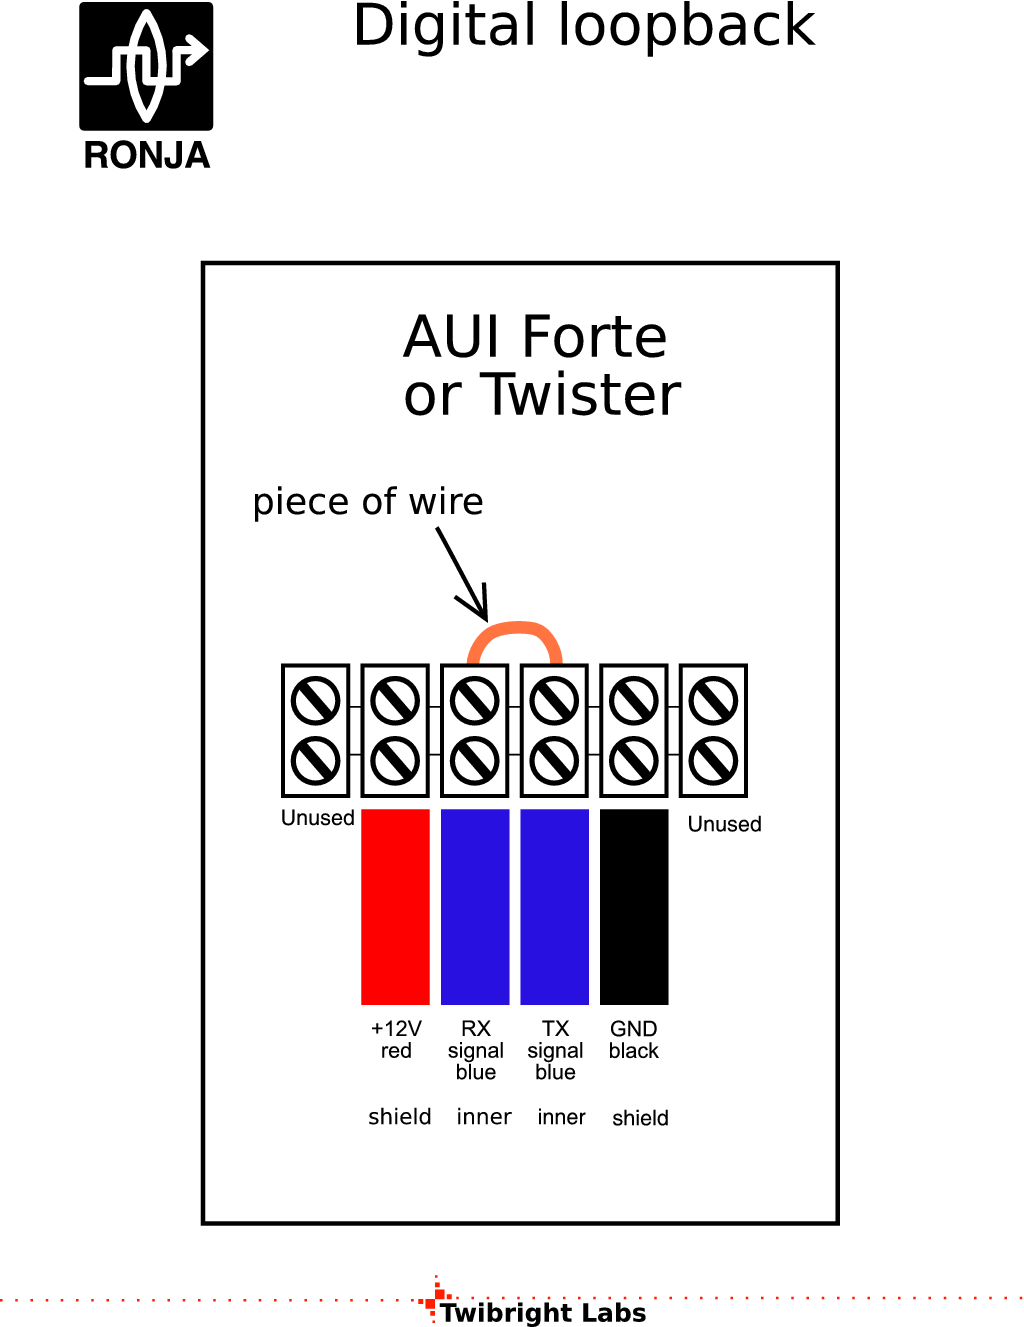